

Process Description
1. Plan Schedule Management [Process / Planning] – We develop Schedule Management Plan, in which we describe how we will plan, implement, and control schedule. So in this process, procedure for planning, implementing and controlling schedule are documented.
a. Activity List
b. Activity Attributes
c. Milestone List
Techniques:
a. Decomposition
b. Expert Judgement
c. Rolling Wave Planning – It is more detailing of work we are going to perform in the near future than the work we will do in far future. It is the form of progressive elaboration. It is used when we don’t have detailed clarity about the entire project at the beginning.
a. We use Precedence Diagramming Method to create Network Diagram (PDM or AON).
b. We use Leads and Lags – Lead means accelerating successor activity. Lead decreases duration. Lag means waiting time between activities. Lag increases duration.
c. We use scheduling software – MS Project or Primavera

b. Finish to Finish (FF) – Completion of successor depends upon completion of predecessor. Although, both can be performed in parallel. Example – Predecessor can be write 10 pages of article and successor can be type 10 pages of article.
c. Start to Start (SS) – Initiation of successor depends upon initiation of predecessor. Example – Predecessor can be gather requirements and successor can be make initial design.
d. Start to Finish (SF) – Rare. Completion of successor depends upon initiation of predecessor. Example – Predecessor can be afternoon shift of current batch and successor can be morning shift of next batch will end. Afternoon shift of current batch will start when Morning shift of next batch will end.
a. Expert Judgement
b. Analogous Estimation – It is used in the early phase of the project when detailed information is not known. Here we provide estimation on the basis of our experience of the similar projects in the past. The estimate we get is called Rough Order of Magnitude estimate. Accuracy is from -25% to 75%. It is form of expert judgement.
c. Parametric Estimation – It is unit rate based estimation. Example – 1 metre of road construction takes 2 minutes then 100 metres of road construction will take 200 minutes.
e. Reserve Analysis – In this case, risk reserve or time buffer is added to deal with identified risks. Reserve is also known as buffer or contingency. We can add it in 2 ways –
i. Add some percentage according to the organization policy (PMO will tell the policy).
ii. Add after calculation from quantitative risk analysis. Risk Reserve = Probability x Impact
Activity Duration = Effort time + Risk Reserve
Three-Point Estimation – It provides PERT estimate, which is weighted average of Optimistic Duration (O), Pessimistic Duration (P), and Most Likely Duration (M).
b. Confidence level can be find out using Standard Deviation (sigma). Standard deviation indicates deviation from the mean. SD = (P-O)/6
More standard deviation means more risk and more unsure our estimate will be.
a. Forward Pass – Find early dates: Early Start (ES), Early Finish (EF)
b. Backward Pass – Find late dates: Late Start (LS), Late Finish (LF)
c. EF = ES + Duration – 1
d. LS = LF – Duration + 1
e. Float or Slack or Scheduling Flexibility = LS – ES or LF – EF
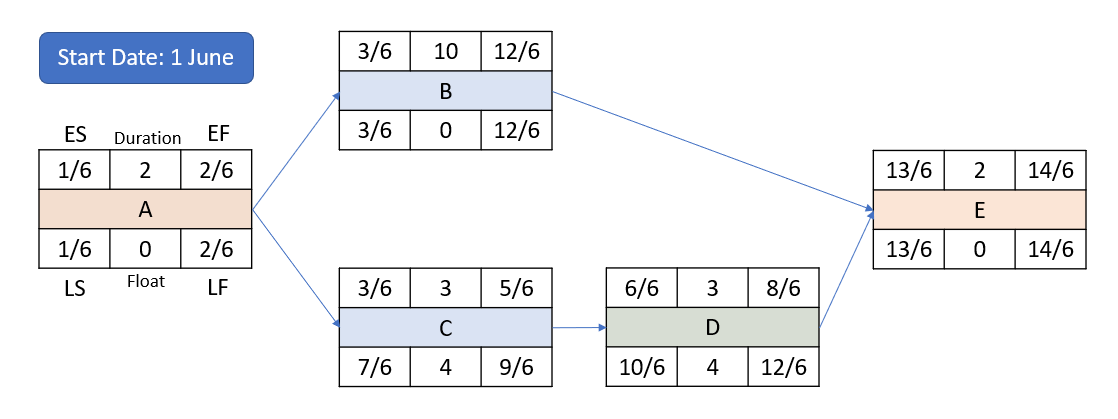
Paths:
a. A -> B -> E = 14 Days [Critical Path]
b. A -> C -> D -> E = 10 Days [Non-Critical Path]
Longest path in the network diagram decides the duration of the project. It is called Critical Path (CP). It has no scheduling flexibility or float or slack. In critical path activities, there is no difference between early dates and late dates.
Paths which are shorter than critical path are known as Non-Critical Path (NCP). It has scheduling flexibility or float or slack. In non-critical path activities, there is difference between early dates and late dates.
Float or Slack of NCP activity = Length of CP – Length of NCP on which activity is situated
Float of NCP activity shared among more than one NCP = Length of CP – Length of longest NCP on which activity is situated
a. A -> B -> C -> D = 30 Days
b. A -> E -> F -> G -> D = 22 Days
d. A -> K -> M -> D = 21 Days
5. Develop Schedule [Process / Planning] – We analyse correctness of input data such as network diagram, activity resource requirements and activity resource estimates.
a. Critical Path Method (CPM) – Most fundamental. In this we use one point estimate as duration of each activities and we perform forward pass and backward pass to calculate float.
b. Schedule Compression – It is used when the delivery date comes earlier than the duration coming after schedule development.
c. What-If scenario analysis – It is used when there are lots of adverse conditions.
e. Resource Leveling – It is used when resource are overloaded or over allocated.
f. Apply leads and lags.
g. Use scheduling software
Critical Path Method (CPM) – In this we use one point estimate as duration of each activities and we perform forward pass and backward pass to calculate float.
Schedule Compression – There are 2 ways to compress schedule. Whether crashing or fast tracking, only critical path activities are involved.
a. Crashing – It requires addition of resources on critical path activities for doing them faster. It increases cost. Goal is to achieve desired compression with minimum additional cost.
b. Fast Tracking – It requires critical path activities to be performed in parallel instead of original sequence. It increases risk. Thumb Rule – Never do fast tracking if dependencies are mandatory. We can do fast tracking if the dependencies are discretionary which is also called preferential or preferred.
What-If scenario analysis – In this process, we analyse to understand the probability of achieving time target under what-if conditions or adverse conditions. For this we use Monte-Carlo simulation software.
| Format | When to use |
| Network diagram with dates | When we need to show logical relationship between activities |
| Bar Chart or Gantt Chart | When we need to show status or progress |
| Milestone Chart | When we need to report to the higher management |
Note: There is no duration of Milestone. It is the name of the achievement.
6. Control Schedule [Process / Monitoring and Controlling] – We check schedule performance and manage changes to the schedule.
In case of variance:
Techniques:
a. Variance Analysis
b. Bar Chart
c. Earned Value Management – Schedule Variance and Schedule Performance Index
d. Schedule Compression
e. What-If Analysis
f. Critical Chain Method
Exercise: Answer at-least 80% of the questions correctly in order to master the topic.
20 Questions Challenge
50 Questions Challenge