

Process Description
1. Plan Risk Management [Process / Planning] – We develop Risk Management Plan in which we document:
1. Approach or Methodology we will use for various Risk Management Processes. Methodology is decided based upon the complexity of the scope which we come to know from the scope statement. The approach or methodology means 3 things:
a. What data source we will use?
b. What techniques we will use?
c. Whom we will involve?
2. Timing and Budgeting for Risk Management processes – Time needed is added in the Project Schedule and Cost needed is added in the Project Budget.
3. Roles and responsibilities for Risk Management processes
4. Definitions of Probability and Impact – This will help us in accessing probability and impact of each identified risks so that we can prioritize them as low, medium or high at the time of Qualitative Risk Analysis.
5. Probability and Impact Matrix – This table is prepared by multiplying all probabilities with their corresponding impacts which provides Risk Scores. Risk Score will help in categorization of risks as low, medium or high. We use Risk Scores in Qualitative Risk Analysis for classification of risks.
6. Risk Categories – This will help us during risk identification so that we may identify risk according to categories. Example of risk categories:
a. Technical – Design, Specification, Functionality
b. External – Suppliers, Clients, Regulatory Authorities
c. Organizational – Infrastructure, Skillset
d. Project Management – No proper estimation, planning
7. Tracking System
8. Reporting formats
9. Revised stakeholder’s tolerances – When we develop Risk Management Plan, we involve stakeholders to get their inputs and consent. During this involvement, stakeholders may realize the complexity of the project. This may help in relaxing their tolerance related to scope, time, cost or quality. We record it as revision in their tolerance.
2. Identify Risks [Process / Planning] – Risk is an uncertain event or condition which may impact the project objectives, if it occurs.
1. Risk is of 2 types:
a. Positive Risk – If the risk impact is good. Example: Opportunity
b. Negative Risk – If the risk impact is bad. Example: Threat
2. We identify risks and document their characteristics and root causes. We document potential responses that comes to our mind at this point. As a result, we get following 2 outputs, which we enter in Risk Register.
a. List of identified risks with their characteristics and root causes.
b. List of potential responses
Techniques:
1. Documentation Review – We review outputs of Planning Processes to understand risk related to scope, time, cost and quality.
2. Expert Judgement
3. Information gathering techniques
a. Brainstorming
b. Interview
c. Delphi – No one knows other people so that their opinion cannot be influenced.
4. SWOT Analysis – Strength, Weakness, Opportunities, Threat
5. Assumptions Analysis
6. Use Risk Checklist – Risk checklist is a quick method of risk identification but we should not rely on it alone as it may not contain all risks which may be there in the current project. When the project is finished, we should enter new risks encountered in the Risk checklist to make it more matured with time.
7. Diagramming Techniques
a. Process Flow Diagram
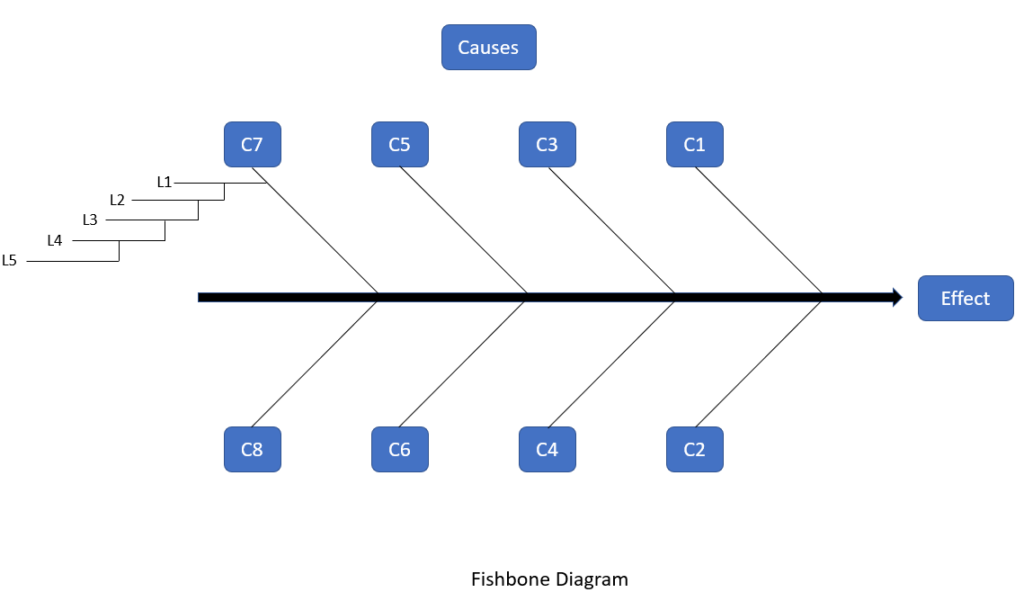
b. Fish bone Diagram – It helps in finding out root causes.
c. Influence Diagram – It helps in finding influence of one risk over other.
Fishbone Diagram – It is the Root Cause Analysis tool.
a. It is also known as Ishikawa Diagram or Cause and Effect Diagram.
b. It helps in knowing causes of future outcome.
c. It helps in knowing causes of an outcome which has occurred.
d. It is made upto 5 levels. Whenever there is a problem, we should ask “Why” 5 times. It is the fifth time we get to know the causes. Before that there are symptoms and not real causes. If we treat symptoms then problem will again come back.
Delphi Technique – A technique to seek common opinion of experts anonymously. No one can bias the data. It removes the biasness from the data. It prevents people from unduly influencing the outcome.
3. Perform Qualitative Risk Analysis [Process / Planning] – In this process, we conduct the followings:
1. We conduct “Probability and Impact Assessment” (technique) to know probability and impact of each identified risks.
2. We use “Probability and Impact Matrix” (technique) to prioritize identified risks as low, medium or high.
3. Low risks are recorded in the document called “Watchlist” and we monitor them during execution. No action plan is made for low risks.
4. High and Medium risks are carried forward for additional analysis. Action plan is made only for high and medium risks.
5. We conduct “Risk Urgency Assessment” (technique) to know risks requiring attention in near term.
6. We conduct “Risk Categorization” (technique) to know common causes or common sources of identified risks.
7. We conduct “Risk Data Quality Assessment” (technique) to ensure we use reliable data.
8. We perform Qualitative Risk Analysis many times during the project execution. This provides the trend in the results of Qualitative Risk Analysis. This trend may suggest the necessity of paying more attention.
9. We enter the outputs in the Risk Register.
4. Perform Quantitative Risk Analysis [Process / Planning] – In this process, we conduct the followings:
1. We do probabilistic analysis of the project through numerical analysis of combined effect of all identified risks on the overall project. We get to know the probability of achieving the schedule target and cost target. Here we use modelling technique known as Monte Carlo simulation software.
2. We find severity level of each identified risks in relation to the project objectives by using sensitive analysis which creates Tornado Diagram.

3. We use Expected Monetary Value (EMV) to decide best course of action in case of uncertainty.
a. EMV (Net Gain) = P x I (Opportunities) + P x I (Threats)
b. We calculate it for all options and picks the one with highest EMV
c. This is known as Decision Tree Analysis

5. Plan Risk Responses [Process / Planning] – We develop risk response plans. Few risks whose response plan we are not able to plan, we record them as Residual Risks. We also record risks which might emerge on implementation of risk response plan which are known as Secondary Risk. We enter these outputs in the Risk Register.
Techniques:
1. Strategies for Negative Risk
a. Avoid
b. Transfer – Insurance, Outsource
c. Mitigate – Preventive Action
i. It can be mitigation of probability. Example: Prototyping
ii. It can be mitigation of impact. Example: Margin of Safety
d. Accept – Whenever we accept a risk, we should make contingency plans and fallback plans. This is known as Active Acceptance. When we accept a risk and do not prepare contingency plan then it is known as Passive Acceptance.
2. Strategies for Positive Risk
a. Exploit
b. Enhance – Enhance Probability or Impact.
c. Share – We make joint venture partnerships.
d. Accept
3. Contingent Response Strategy – This action is taken only under certain pre-conditions such as missing intermediate milestones.
After Risk Response Plans are developed, we update Project Management Plan (WBS, Schedule, Budget).
Planning Flowchart
Risk Response Plans represents the work which we will perform for the identified risks. This work was not part of WBS when we created it. Therefore, we go back and this work in the WBS which revises Scope Baseline. Time and Cost required for this work were not part of the Schedule and Budget. Therefore, we add them in Schedule and Budget which revises Schedule Baseline and Cost Baseline. WBS, Schedule and Budget are not final until Risk Response Plans are developed.
6. Implement Risk Responses [Process / Executing] – It is the process for implementing agreed upon risk response plans. This helps in addressing the overall risk exposure along with reducing project threats and increasing project opportunities.
7. Monitor Risks [Process / Monitoring and Controlling] – We check our performance and manage risks.
d. Inform concerned stakeholders
Exercise: Answer at-least 80% of the questions correctly in order to master the topic.
20 Questions Challenge
50 Questions Challenge